Matplotlib for HEP
Contents
Matplotlib for HEP#

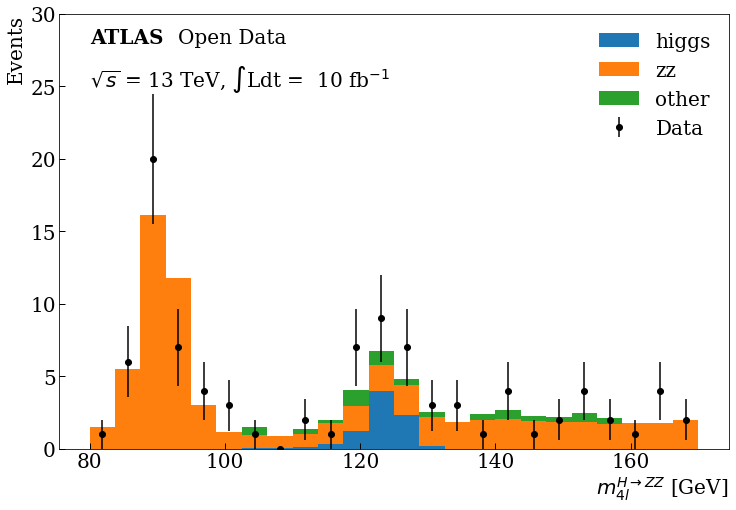
This training module introduces matplotlib and creates plots commonly used in HEP. It also introduces mplhep, a plotting library designed specifically for HEP plots.
This training module is part of the HSF Software Training Center, a series of training modules that serves HEP newcomers the software skills needed as they enter the field, and in parallel, instill best practices for writing software.
Table of Contents#
Topic |
|
|---|---|
1 |
|
2 |
|
3 |
|
4 |
|
5 |
You can build this book locally on the command line following these steps:
Install Anaconda
Install Jupyter Book using conda
conda install -c conda-forge jupyter-book
Create a new environment and activate it
conda create --name jupyter_book
conda activate jupyter_book
Clone the repository containing the book source files
git clone git@github.com:amorenobr/matplotlib_for_hep_jb.git
Build your Jupyter Book
jb build --all matplotlib_for_hep_jb
View the Jupyter Book in a browser
google-chrome-stable _build/html/index.html
firefox _build/html/index.html
